Codesys
In this tutorial, you'll learn how to use Codesys with the SoftPLC emulator to connect to ATOM using EtherNet/IP and perform some basic operations and monitor data. You can follow along using the SoftPLC emulator or your own PLC.
We provide examples for both ladder logic and structured text.
If you haven't yet, please review ATOM's EtherNet/IP Profile.
If you'd like to skip the tutorial, you can download a completed example project:
- Download ATOM_Codesys_LadderLogic_Example.zip
- Download ATOM_Codesys_StructuredText_Example.zip
Prerequisites
Hardware setup
Connect 24V to your PLC and Atom unit with the provided power cable. Connect Atom to your PC with an Ethernet cable.
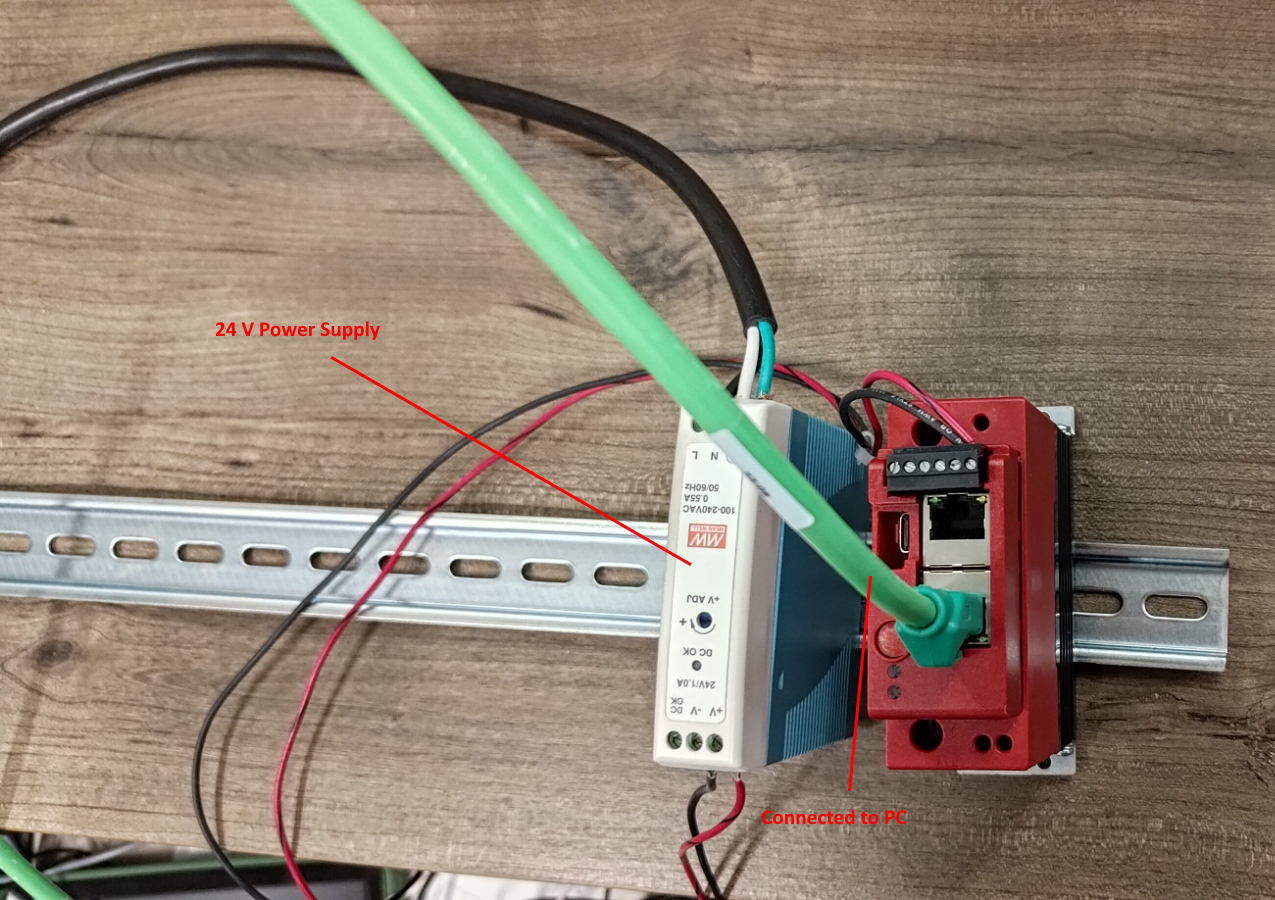
To simplify this diagram, we have not connected a load to Atom. You may connect a load or leave it disconnected, either way is fine for the purposes of this tutorial.
If you do not connect a load, you can still verify your PLC is working by connecting a USB cable to Atom and using Control Panel to watch the parameters change/verify the PLC is receiving the correct monitor data.
Configuring Atom network settings
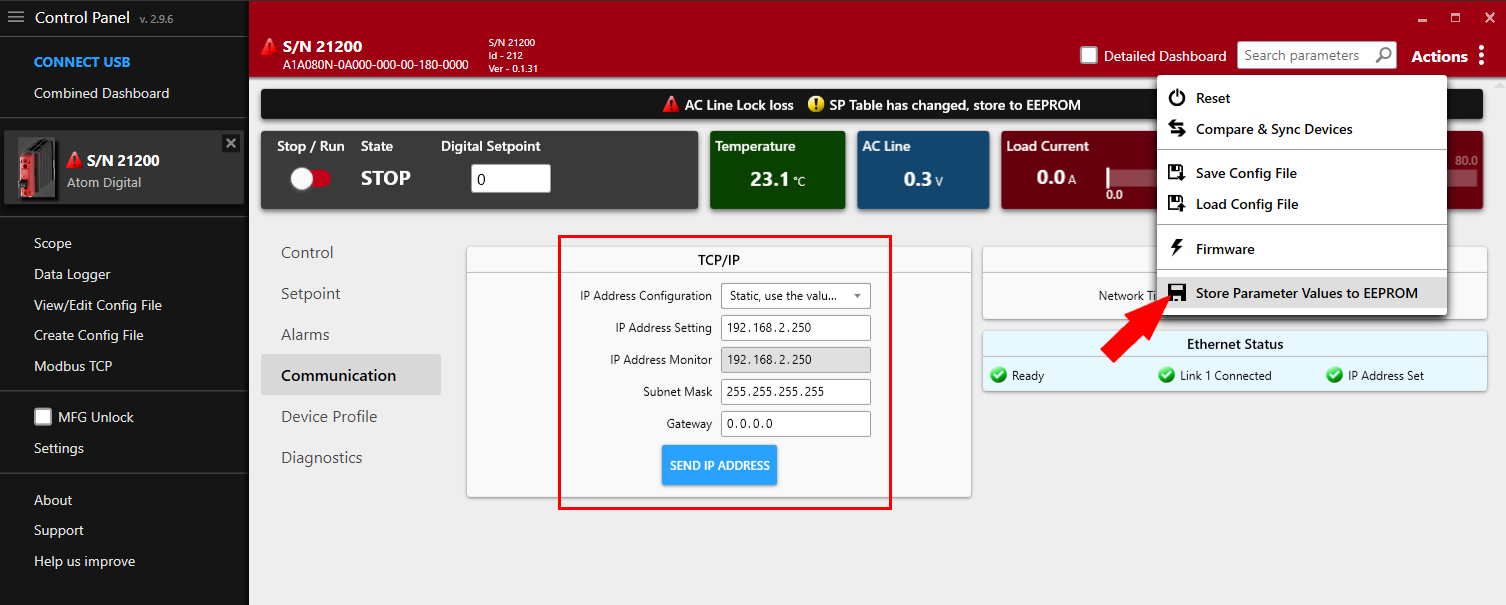
Connect your Atom unit to your PC using a USB cable. Open Control Panel and update your Atom's communication parameters. When you're finished, click Send IP Address, then go to Actions in the upper right and select Store Parameter Values to EEPROM:
Create a Codesys project
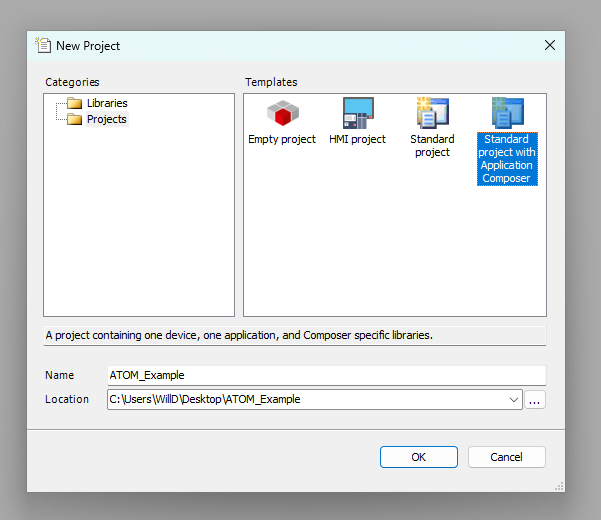
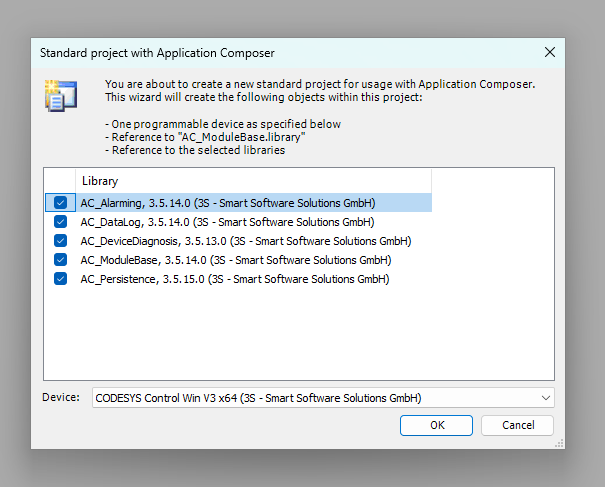
Create a new Codesys project using the Standard project with Application Composer template:
Check each library to include it in the project and select CODESYS Control WIN V3 x64 as the device:
Adding an EtherNet/IP Scanner
Next we'll add an EtherNet/IP Scanner module. This allows the PLC to discover EtherNet/IP devices on the network (in our case, ATOM) and establish a connection with them.
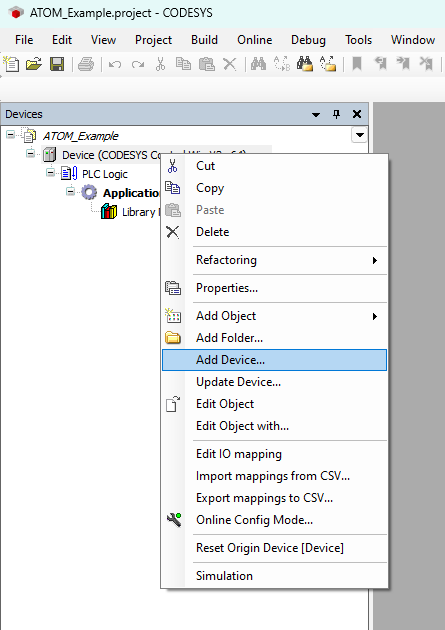
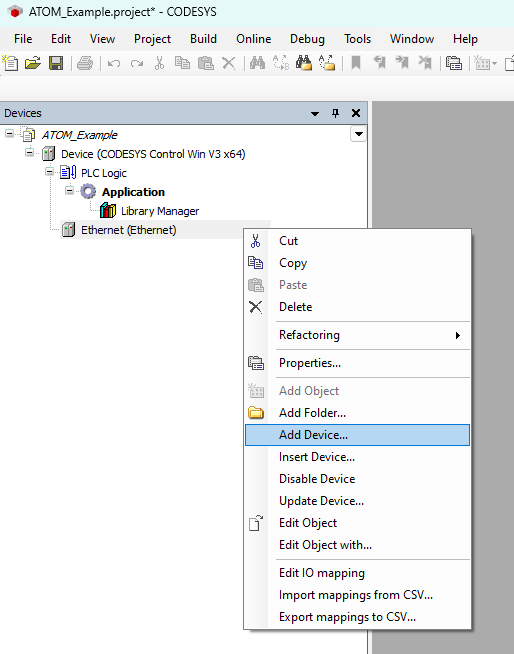
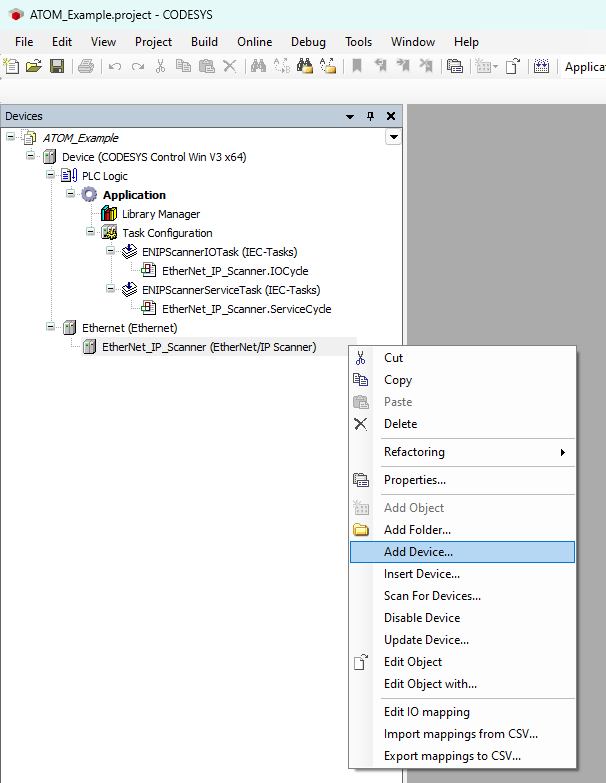
First, right click Device and select Add Device:
Next, expand Ethernet Adapter and select Ethernet, then click Add Device:
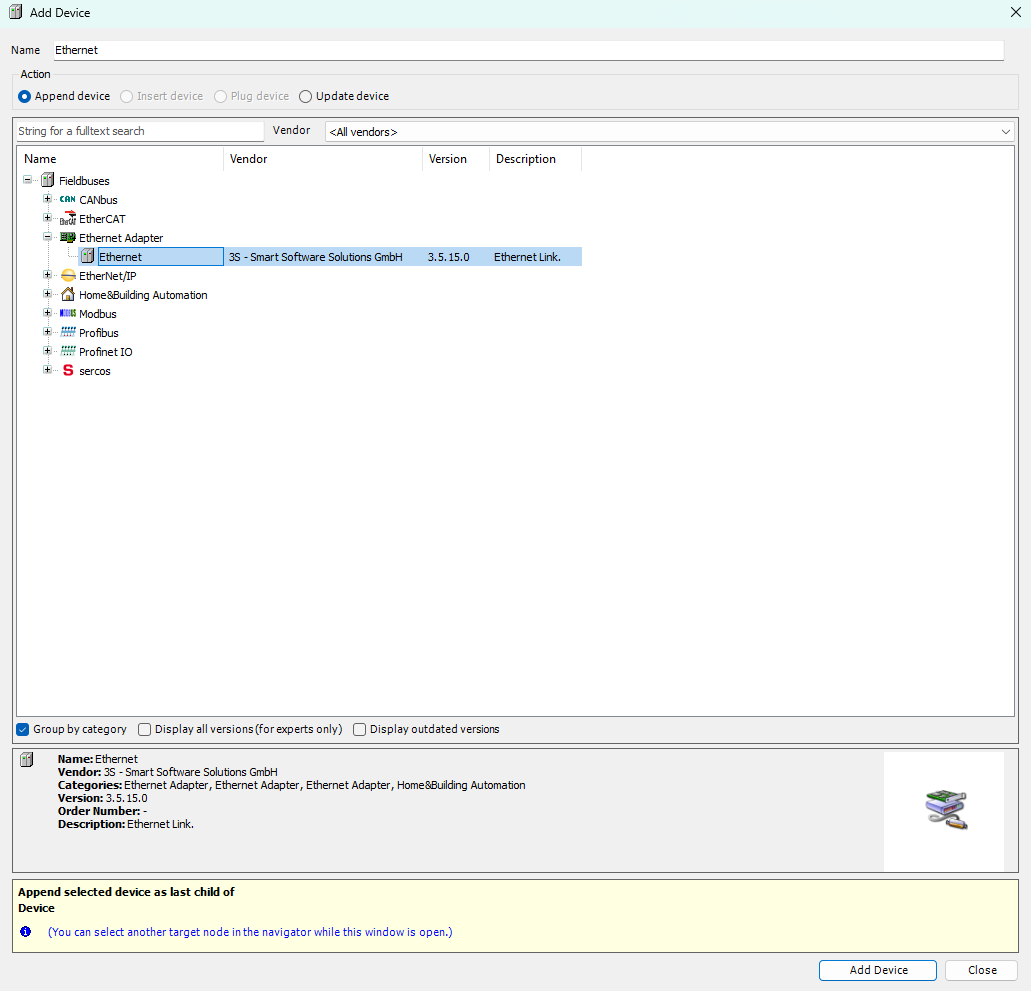
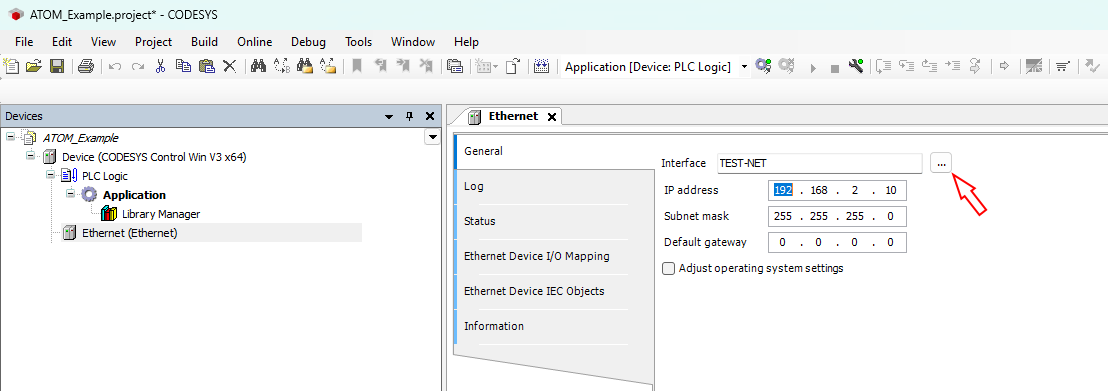
The newly added Ethernet device will now appear in the device tree. Double click Ethernet (Ethernet) to open its configuration tab.
Within the General configuration tab, use the button indicated by the red arrow to select the network interface of the host machine that will
be used to communicate with ATOM. In our case, we have a TEST-NET interface but this will be different for you.
Next, right click Ethernet (Ethernet) and select Add Device:
Expand EtherNet/IP Scanner, select EtherNet/IP Scanner, then click Add Device:
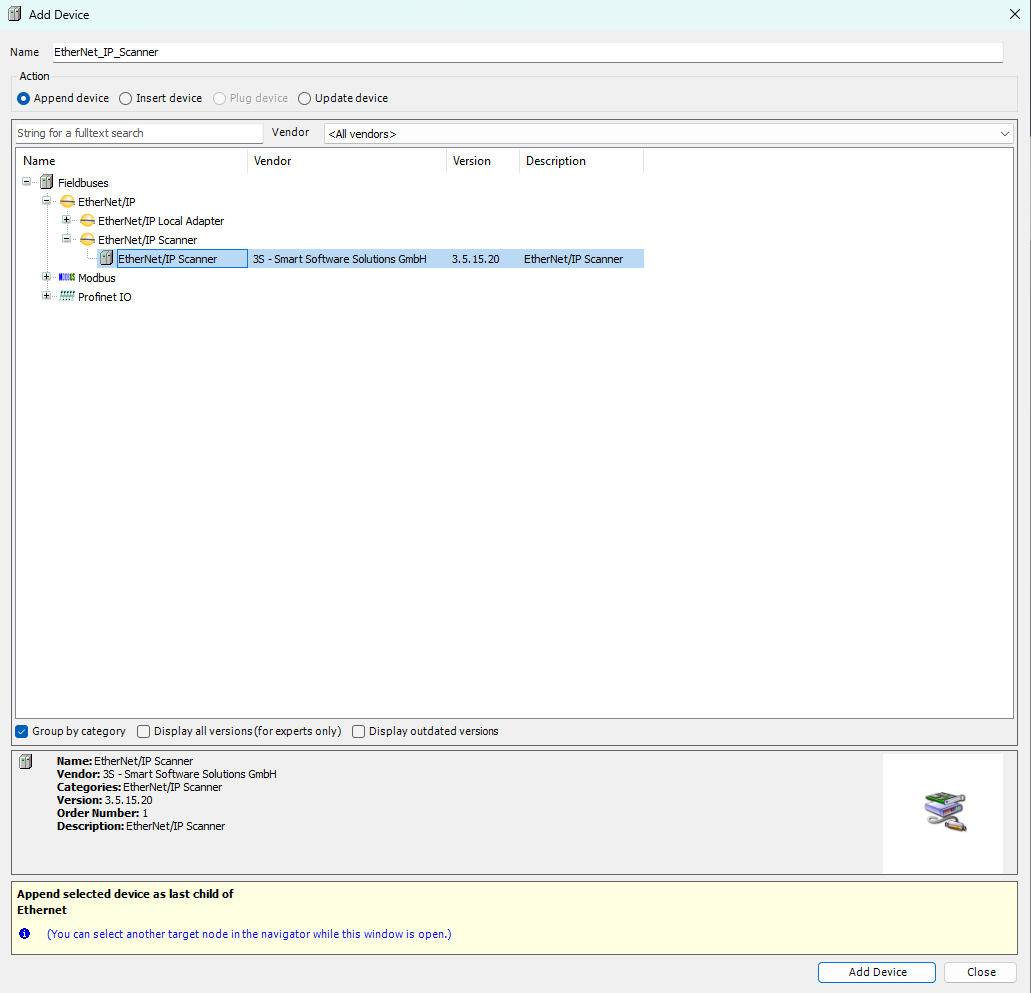
Your device tree should update to include the EtherNet/IP Scanner device.
Adding ATOM to the scanner
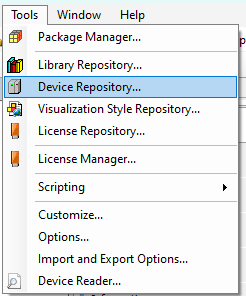
First, we'll import ATOM's EDS file you downloaded earlier into our Codesys device library. Open the tools menu and select Device repository:
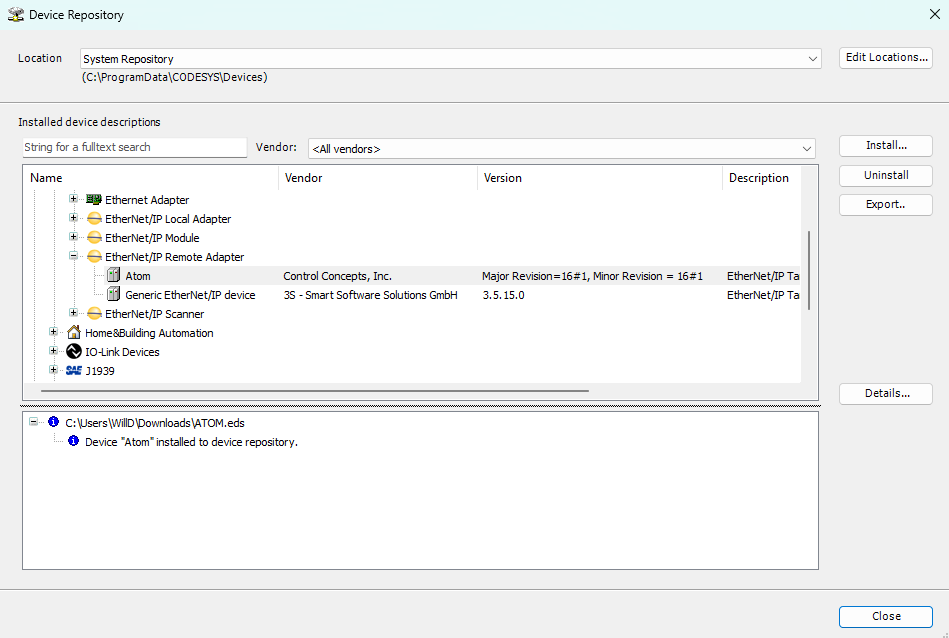
Next, click Install and select the ATOM.eds file. After you click install,
Atom will appear under the EtherNet/IP Remote Adapter category. Click Close to dismiss the dialog:
Now, we'll add ATOM to the scanner. Right click EtherNet/IP Scanner (EtherNet/IP Scanner) and select Add Device:
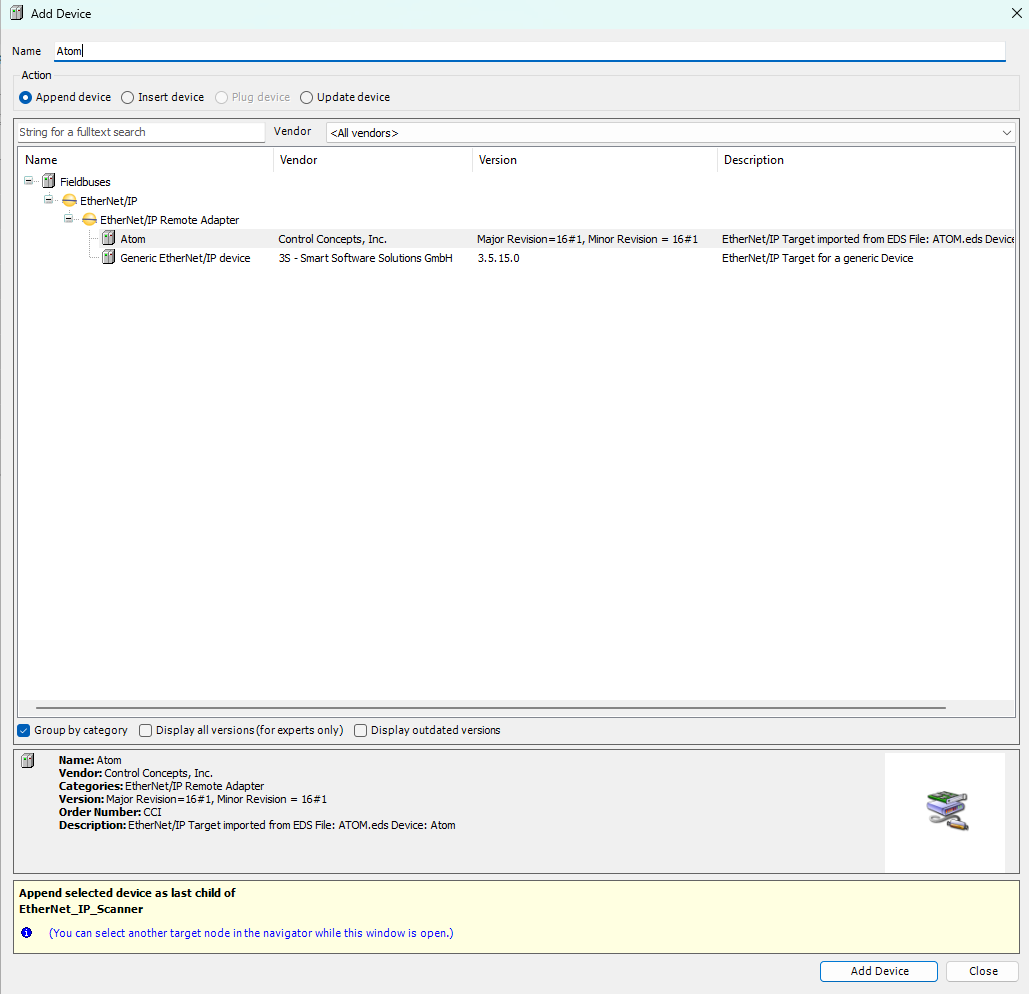
Expand EtherNet/IP Remote Adapter and select Atom, then click Add Device:
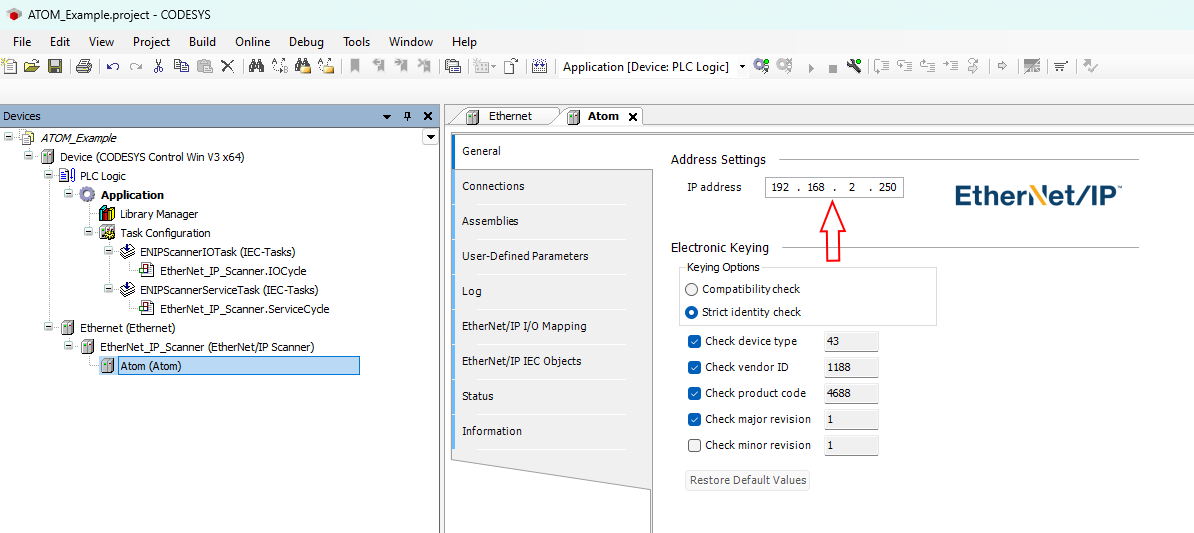
Finally, double click Atom (Atom) to open its configuration tab. In the General tab, set the IP Address to the IP address of your ATOM device:
Create a program
Next, we'll create a PLC program. We provide examples for both ladder logic and structured text:
Example: Ladder logic
Creating the program
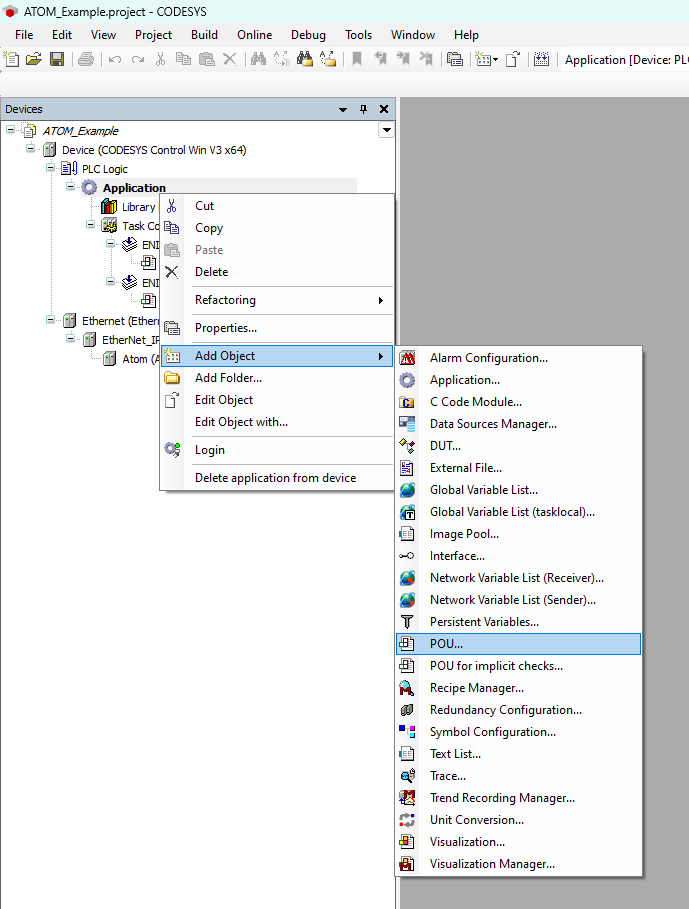
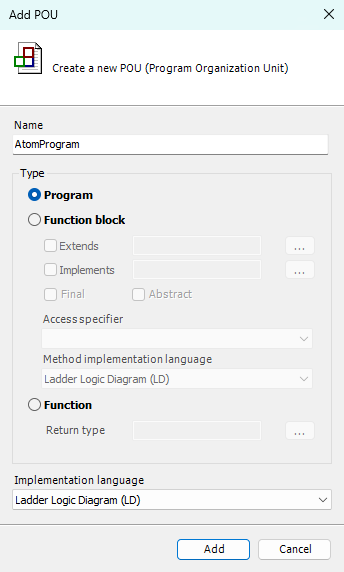
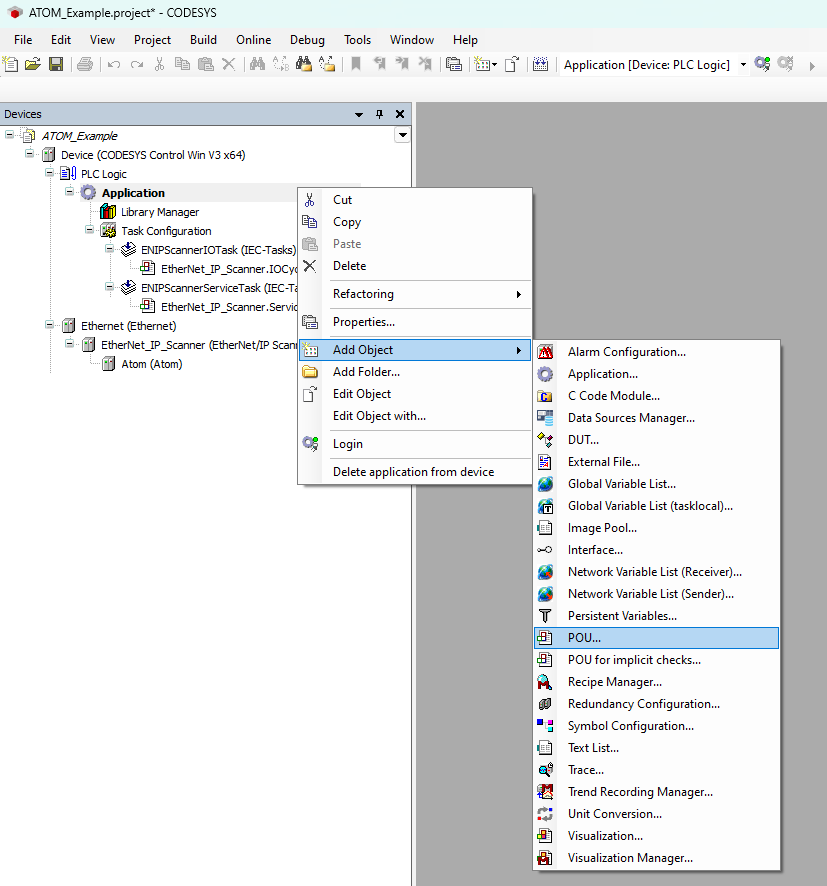
Right click Application and select Add Object > POU:
Set the name to AtomProgram and select Ladder Diagram (LD) as the Implementation language:
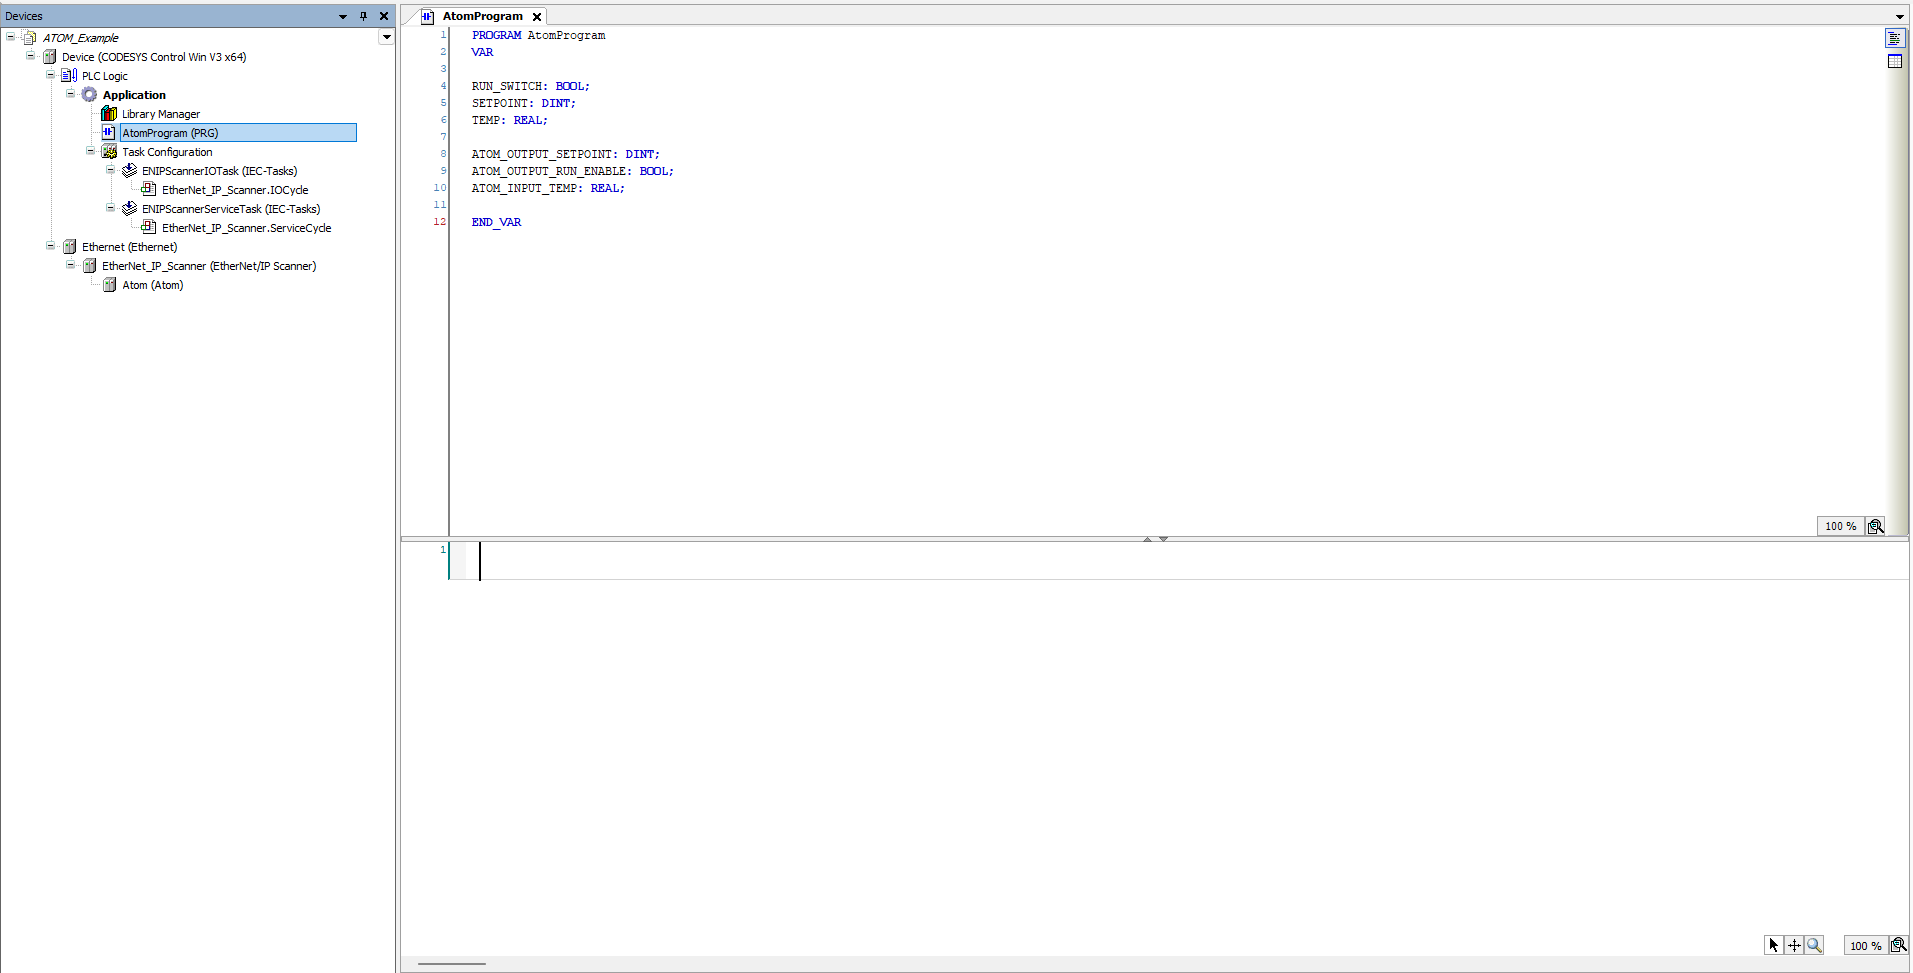
Copy the following code into the top panel of the AtomProgram editor:
PROGRAM AtomProgram
VAR

RUN_SWITCH: BOOL;
SETPOINT: DINT;
TEMP: REAL;

ATOM_OUTPUT_SETPOINT: DINT;
ATOM_OUTPUT_RUN_ENABLE: BOOL;
ATOM_INPUT_TEMP: REAL;

END_VAR
After you've copied the code over, the editor for AtomProgram should look like this:
In the bottom panel of the editor, we'll create a simple ladder logic program using the variables we just added above.
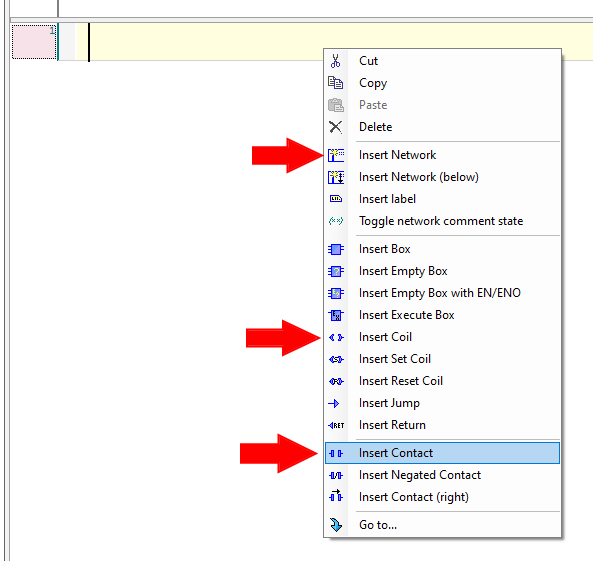
- Create 3 networks total by right-clicking and selecting Insert Network
- For each network, right click and insert one contact and one coil
After you're finished, your ladder logic program should look like:

For each rung, replace the ??? with the corresponding variables:
- Rung #1 -
RUN_SWITCHandATOM_OUTPUT_RUN_ENABLE - Rung #2 -
SETPOINTandATOM_OUTPUT_SETPOINT - Rung #3 -
ATOM_INPUT_TEMPandTEMP
After you're finished, your ladder logic program should look like:

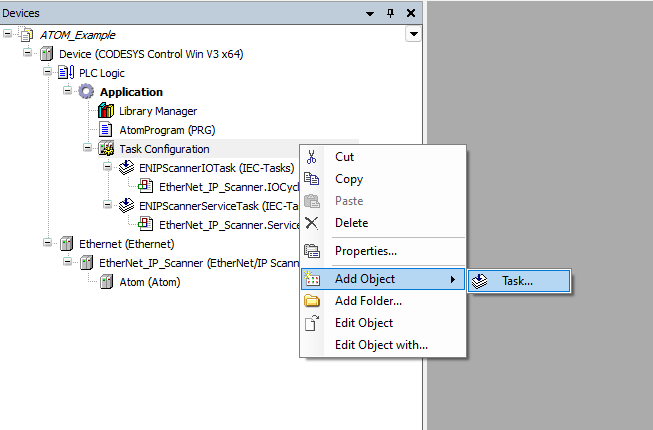
Finally, we'll add a task to call AtomProgram from the PLC's control loop:
Right click Task Configuration and select Add Object > Task:
Name your task AtomTask and click OK:

Next, double click AtomTask (IEC-Tasks) to open its configuration tab. Click Add Call and select Application > AtomProgram. After doing so, AtomTask's configuration should look like:

Setting up visualization
Next, we'll set up a simple visualization display to control and monitor ATOM.
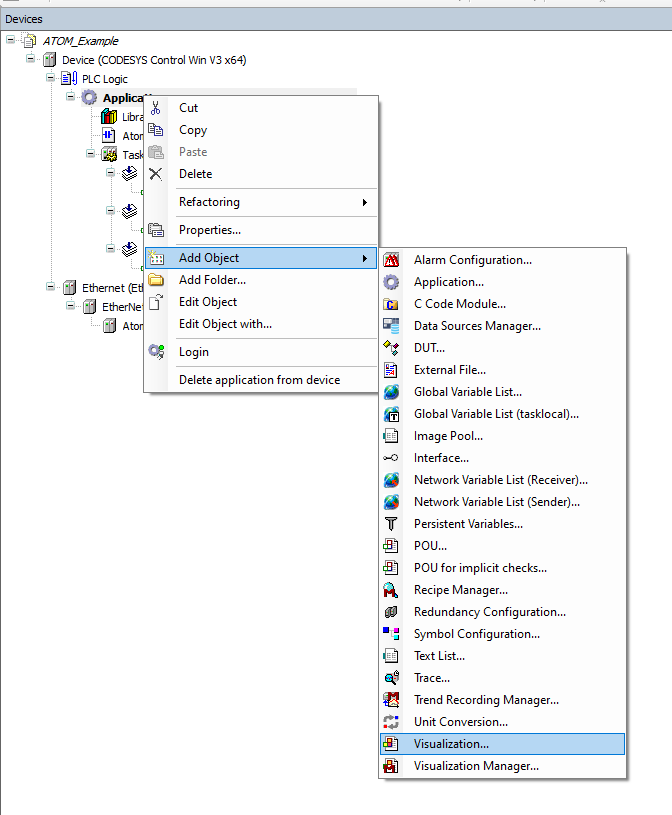
Right click Application and select Add Object > Visualization:
Make sure to check Active for VisuSymbols (System), then click Add:
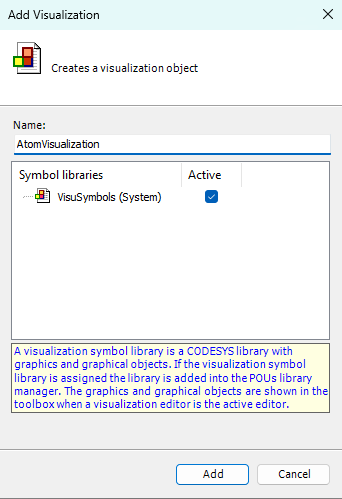
Name your visualization AtomVisualization and click Add:

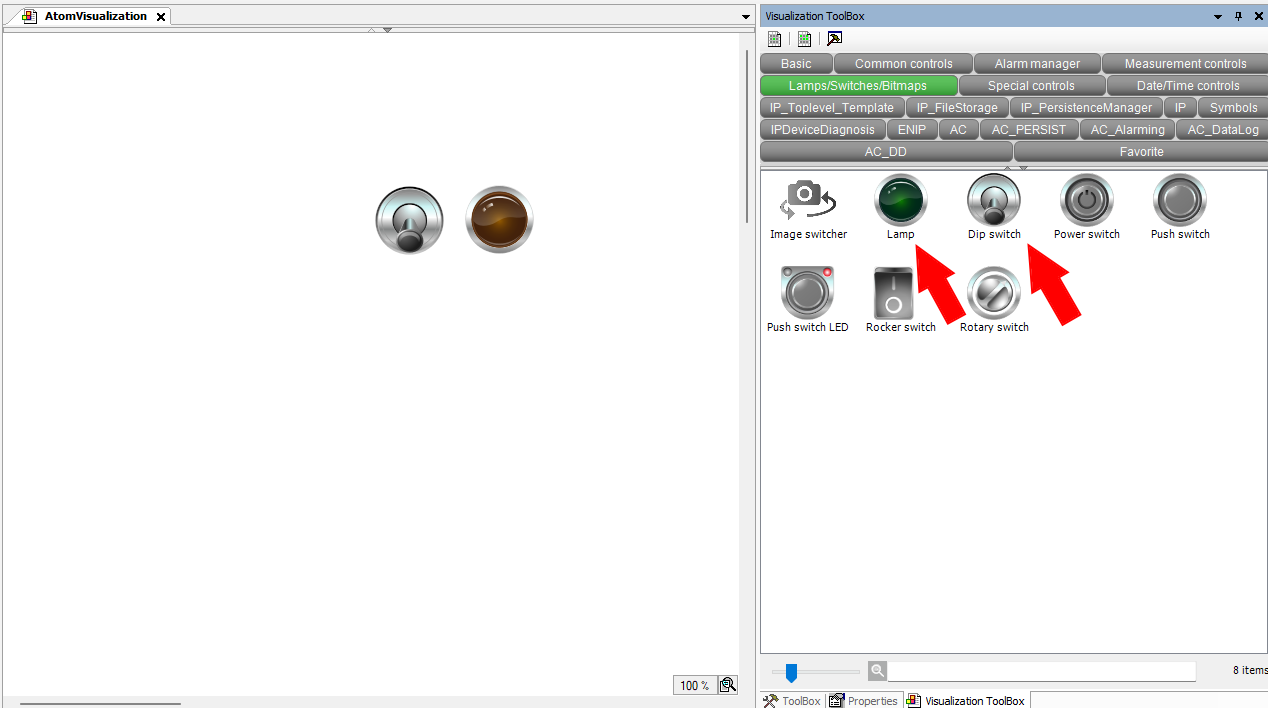
Double click AtomVisualization to open its configuration editor. From the Visualization ToolBox panel on the right, select the Lamps/Switches/Bitmaps category and add a lamp and a dip switch:
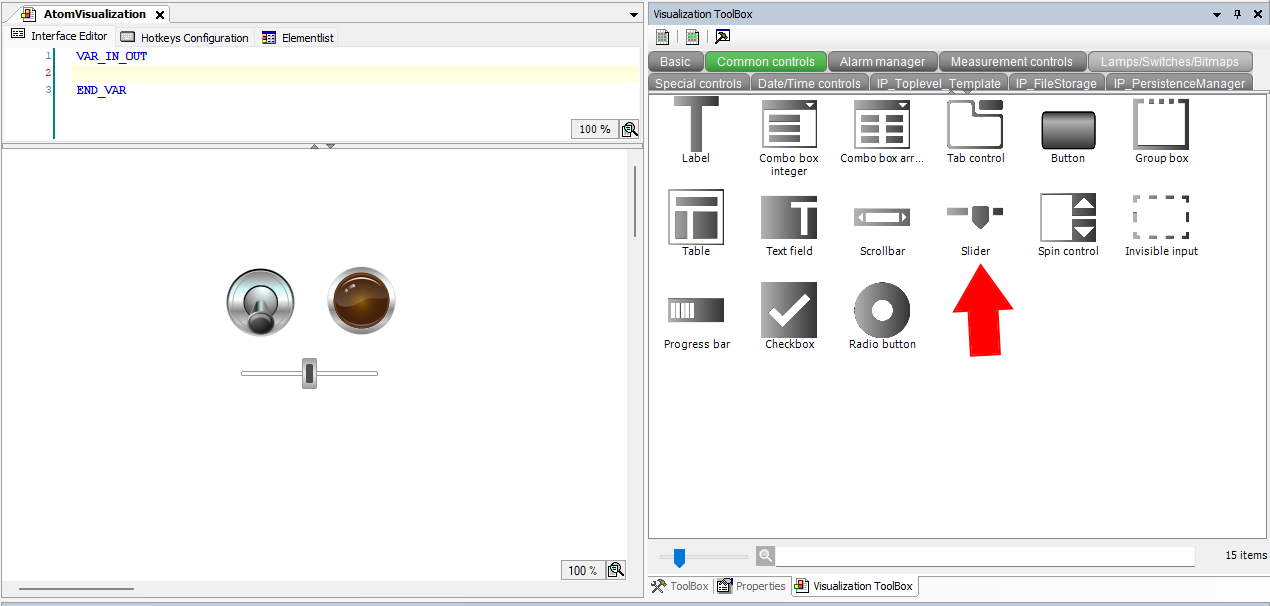
Next, in the Common controls category, add a slider:
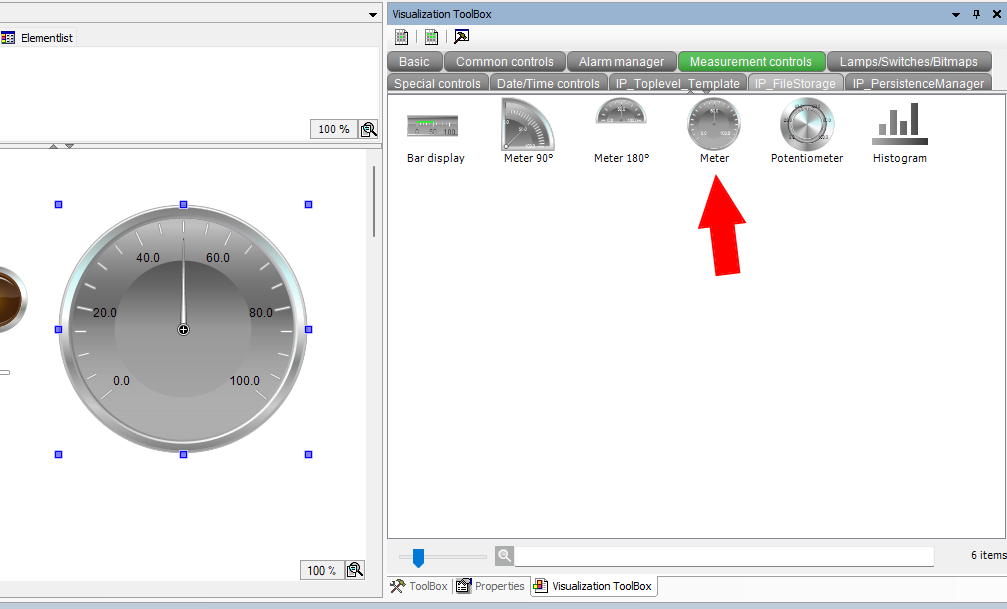
Finally, in the Measurement controls category, add a meter:
Wiring up the controls
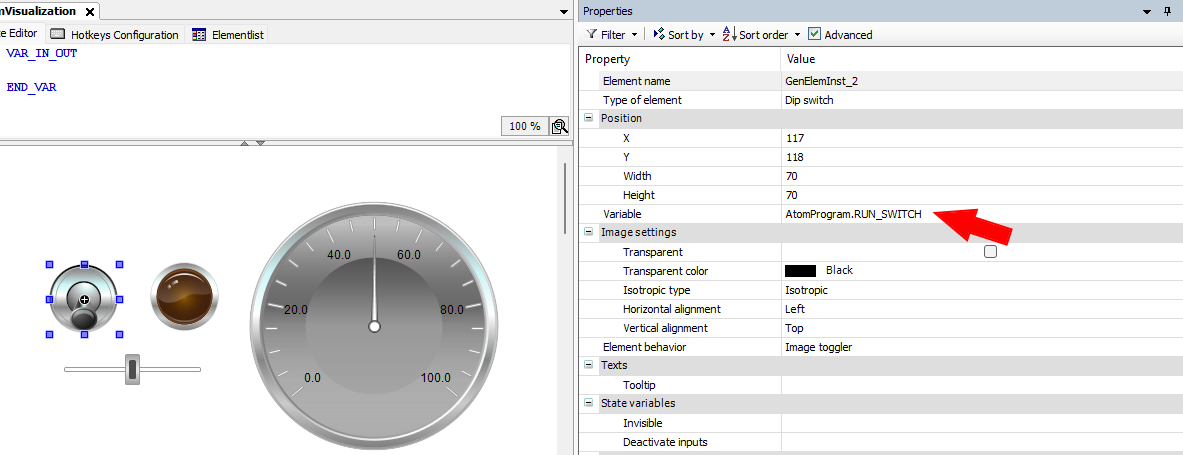
Next, we'll connect the controls to our PLC program. Select the dip switch and set
the Variable field to AtomProgram.RUN_SWITCH as indicated by the red arrow:
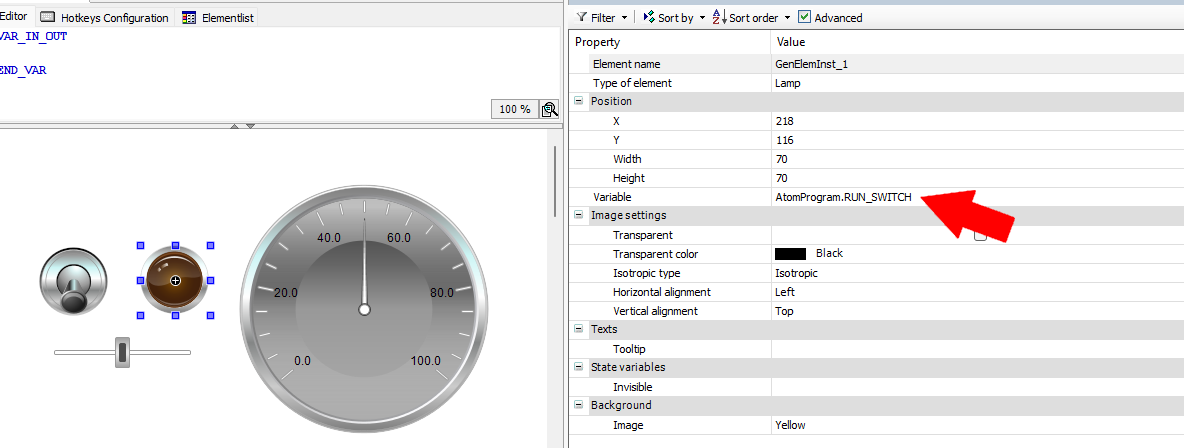
Select the lamp and set the Variable field to AtomProgram.RUN_SWITCH as indicated by the red arrow:
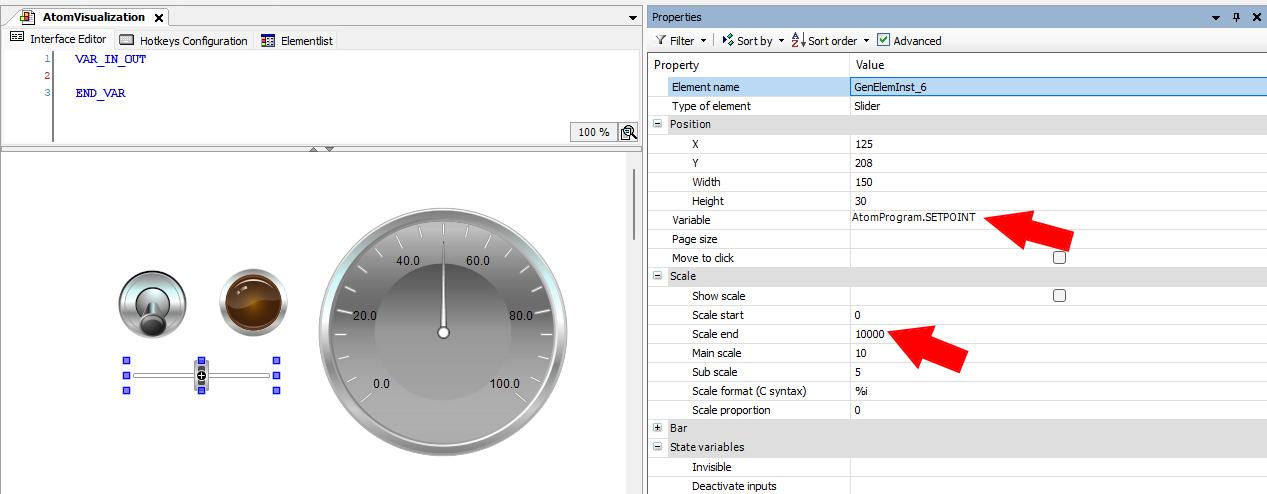
Select the slider and set the Variable field to AtomProgram.SETPOINT and set Scale end to 10000:
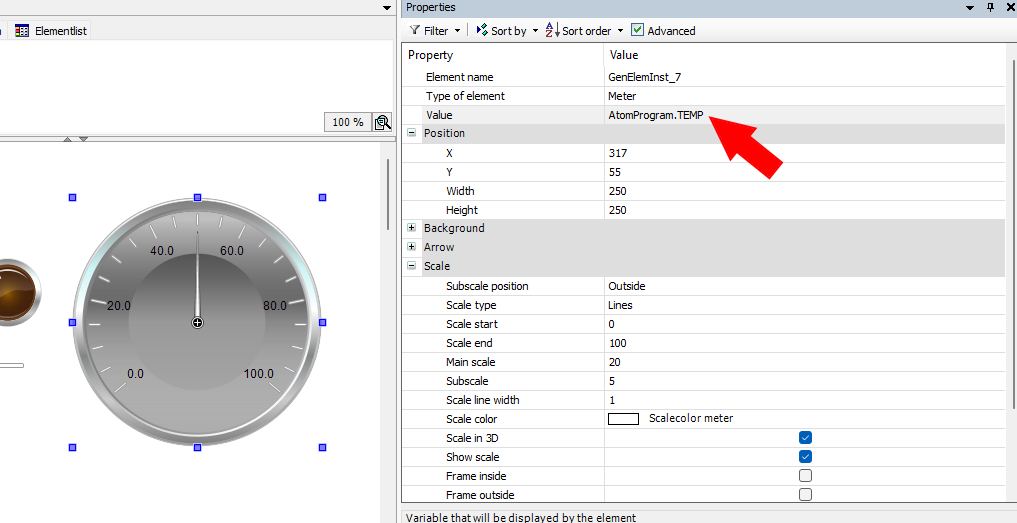
Select the meter and set the Variable field to AtomProgram.TEMP:
Mapping variables
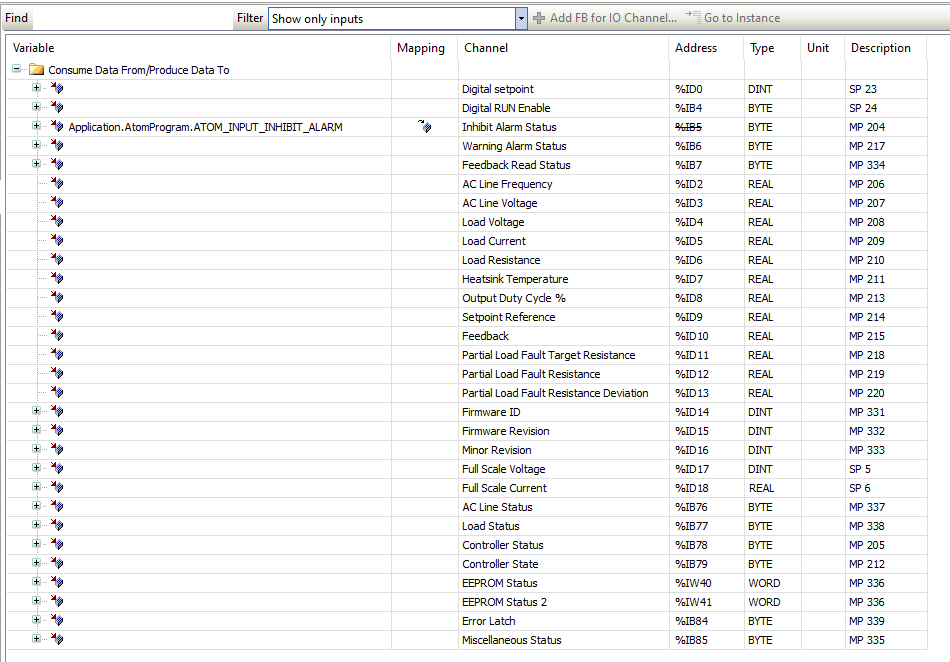
Finally, we'll map our PLC variables to ATOM. Double click Atom in the device tree to open its configuration window. Select the EtherNet/IP I/O Mapping tab and set Filter to Show only inputs:
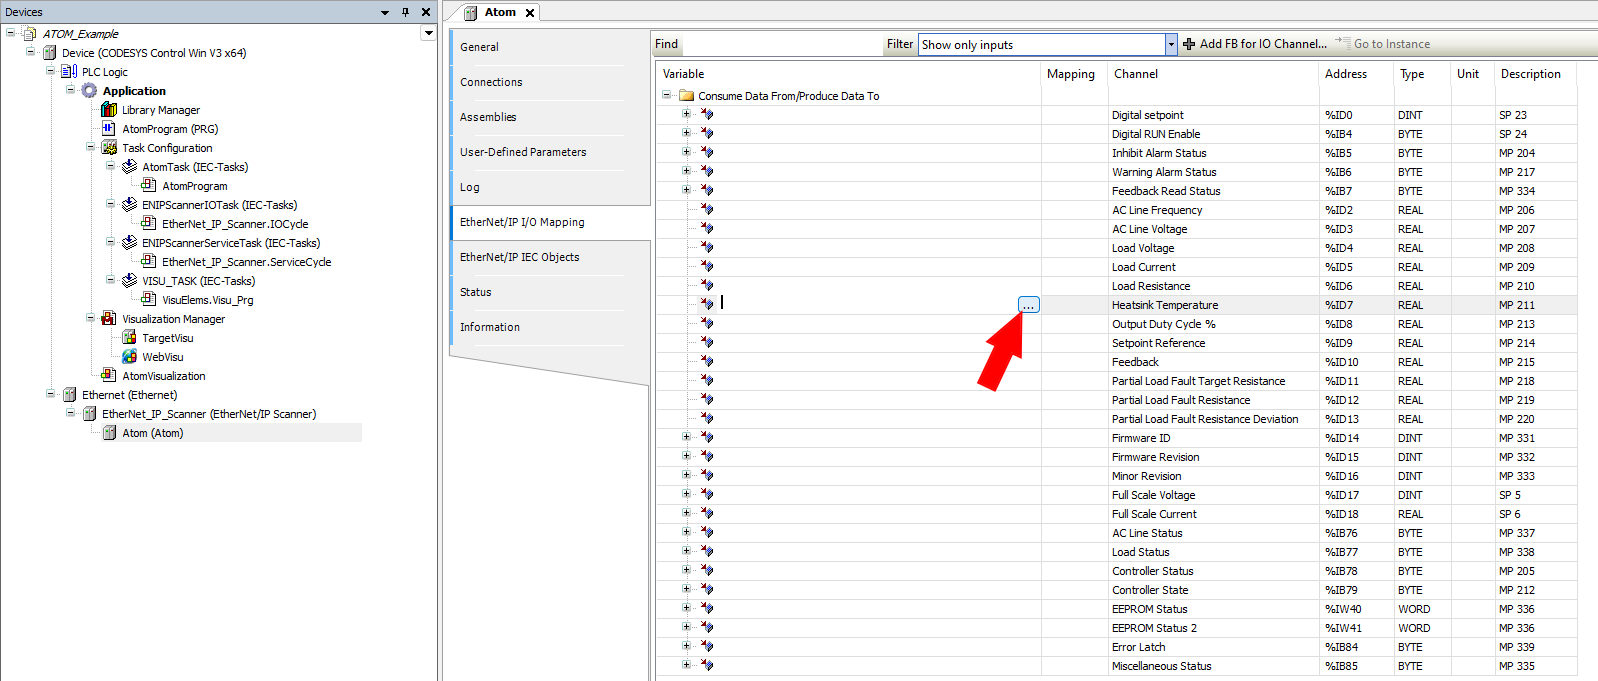
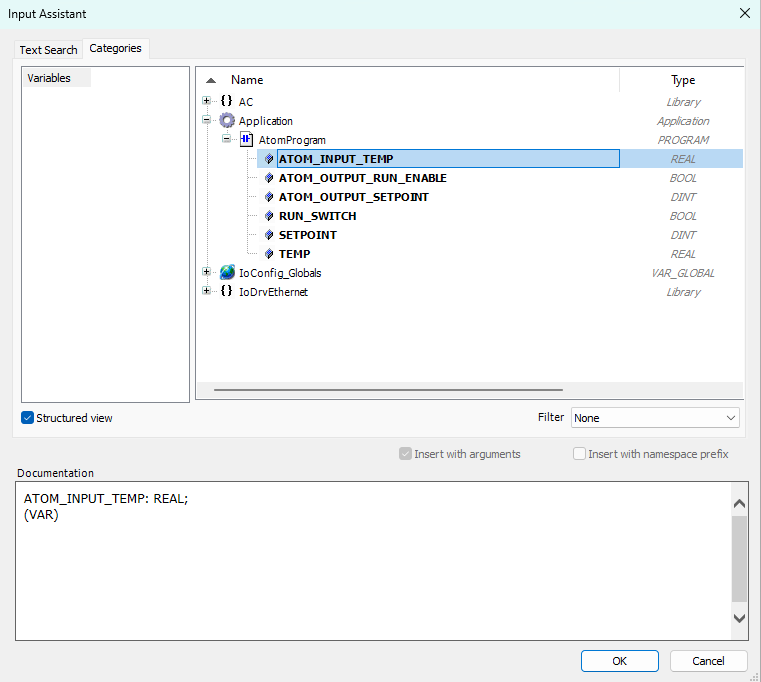
Above, select the button indicated by the red arrow. This will open the Input Assistant dialog. Select Application > AtomProgram > ATOM_INPUT_TEMP and click Add:
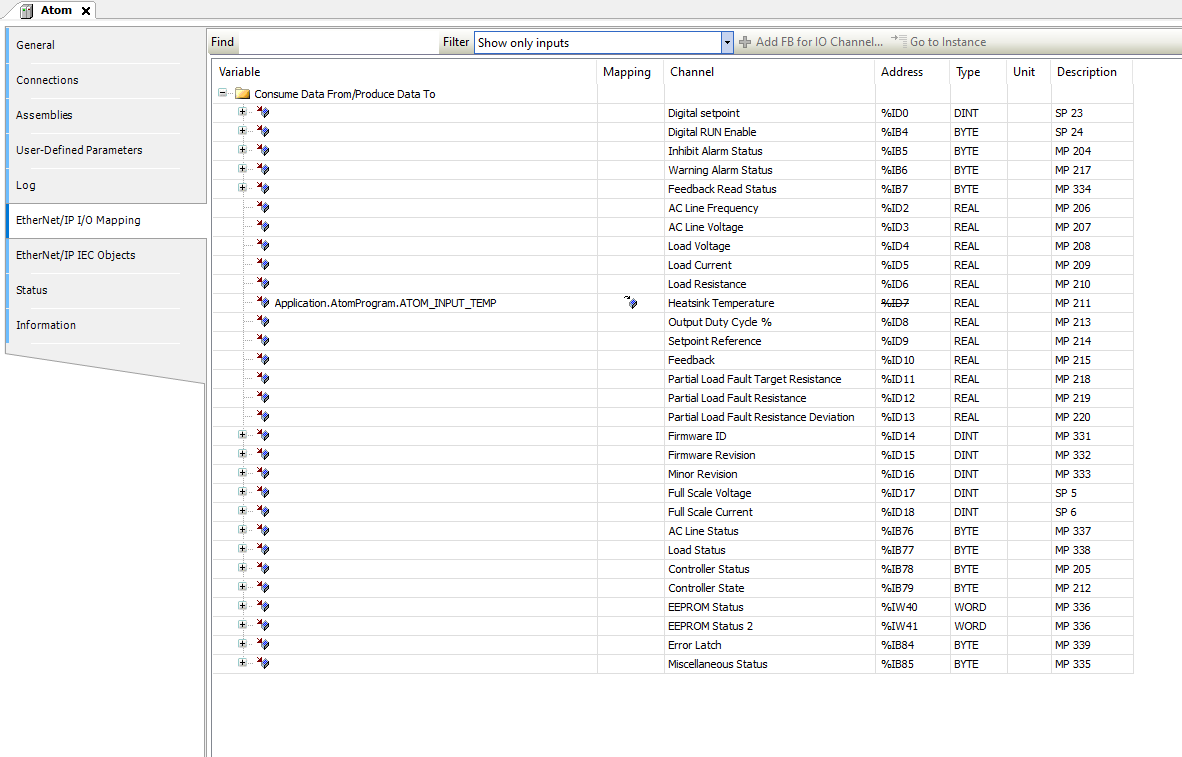
After doing so, your input I/O mappings should look like:
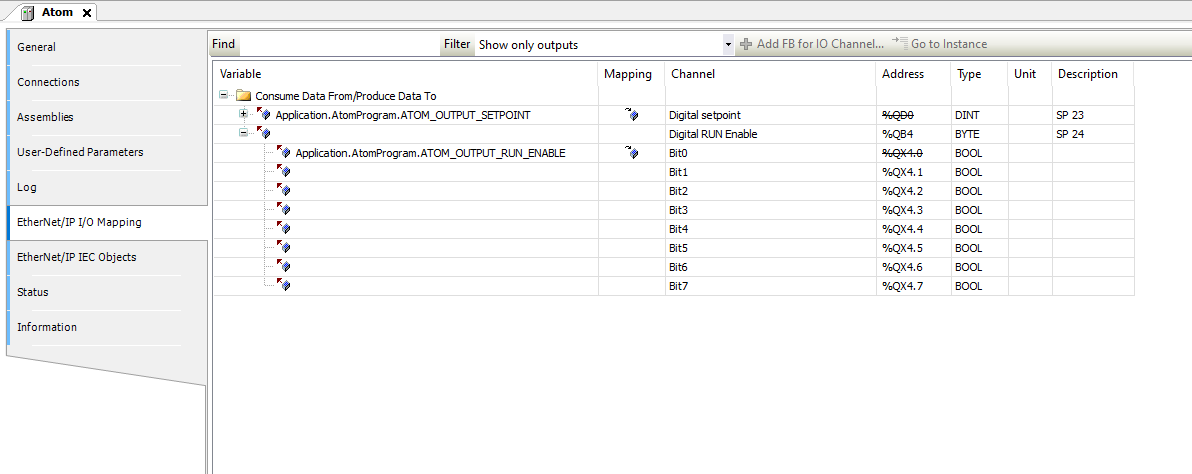
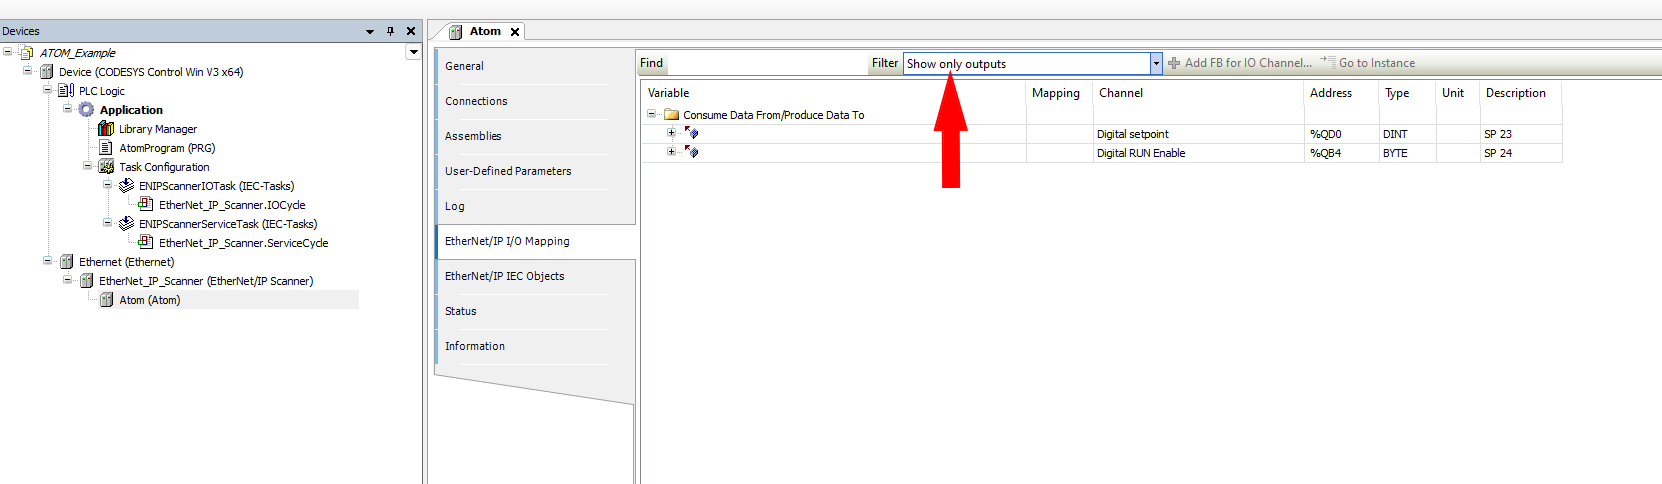
Change the Filter to Show only outputs and repeat the process for the outputs. Map Digital setpoint
to Application.AtomProgram.ATOM_OUTPUT_SETPOINT and Digital RUN Enable to Application.AtomProgram.ATOM_OUTPUT_RUN_ENABLE.
Make sure you map Bit0 of Digital RUN Enable to ATOM_OUTPUT_RUN_ENABLE, NOT Digital RUN Enable itself.
Example: Structured text
Creating the program
Right click Application and select Add Object > POU:
Name your POU AtomProgram and select Structured Text (ST) as the language:

Next, let's create a basic program. We'll check to make sure no alarms are active and then write a setpoint value of 8000 and set run enable to true.
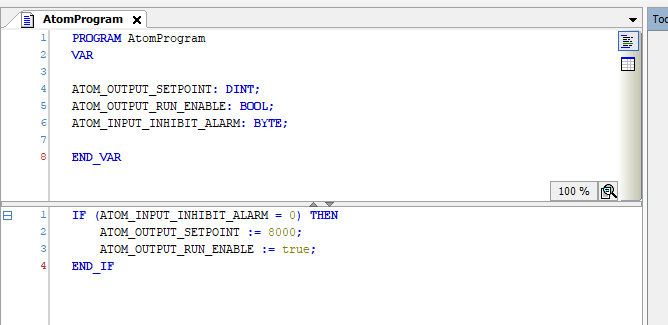
Copy the following code into the top panel of the AtomProgram editor:
PROGRAM AtomProgram
VAR

ATOM_OUTPUT_SETPOINT: BOOL;
ATOM_OUTPUT_RUN_ENABLE: BYTE;
ATOM_INPUT_INHIBIT_ALARM: BYTE;

END_VAR
Copy the following code into the main program section:
IF (ATOM_INPUT_INHIBIT_ALARM = 0) THEN
	ATOM_OUTPUT_SETPOINT := 8000;
	ATOM_OUTPUT_RUN_ENABLE := true;
END_IF
Your editor should look like:
Next, we'll add a new task to call our program. Right click Task Configuration and Select Add Object > Task:

Name your task AtomTask and click Add:
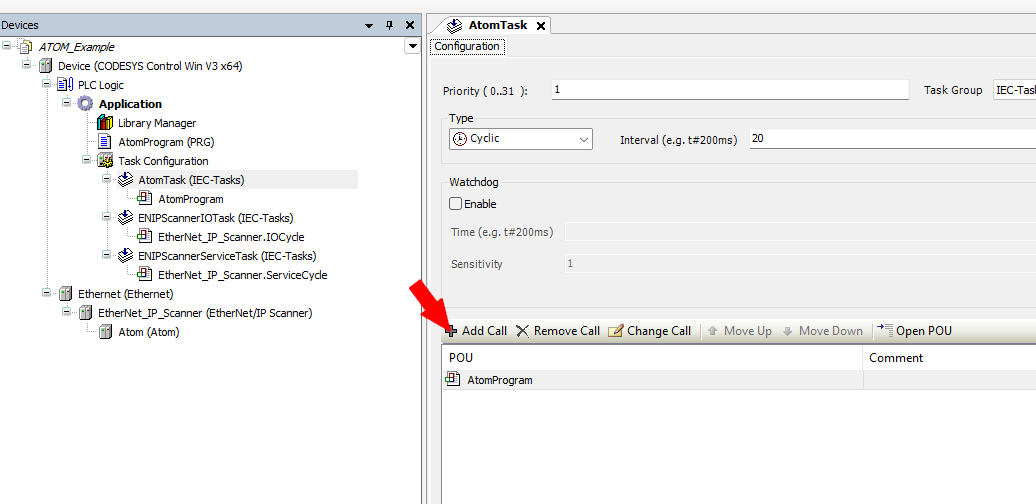
Next, double click AtomTask (IEC-Tasks) to open its configuration tab. Click Add Call and select Application > AtomProgram. After doing so, AtomTask's configuration should look like:
Mapping variables
Next, we'll map our ATOM's I/O configuration to our program variables. Double click Atom (Atom) to open its configuration window, then select the EtherNet/IP I/O Configuration tab. On the Filter dropdown indicated by the red arrow, select Show only outputs:
Click the button indicated by the red arrow to map the Digital setpoint value:

This button will open the Input Assistant dialog. Select the corresponding variable from your program and click Ok:

Repeat this process so that your output variables are mapped like so:
Make sure you map Bit0 of Digital RUN Enable to ATOM_OUTPUT_RUN_ENABLE, NOT Digital RUN Enable itself.
Switch the filter to Show only inputs and then map the Inhibit alarm status variable:
Running the program with SoftPLC
The instructions to run your program are the same regardless of whether you are using ladder logic or structured text.
The only difference is that in the ladder logic example, a visualization window will open that allows you to control ATOM.
To debug the program, first make sure you start Codesys WIN Control V3 - x64 SysTray
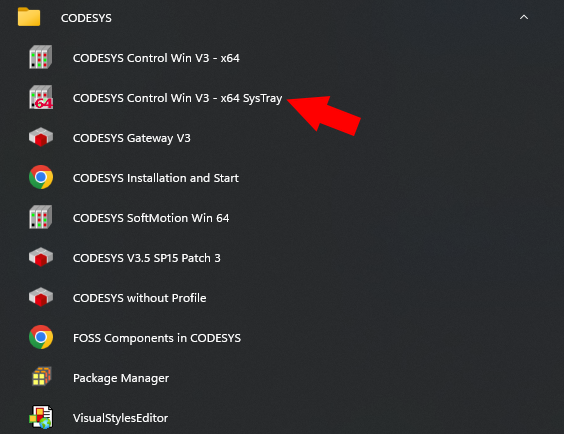
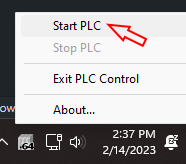
This will launch the Codesys SoftPLC. You should see an icon appear in your systray and you can right click it and select Start PLC to start the SoftPLC:
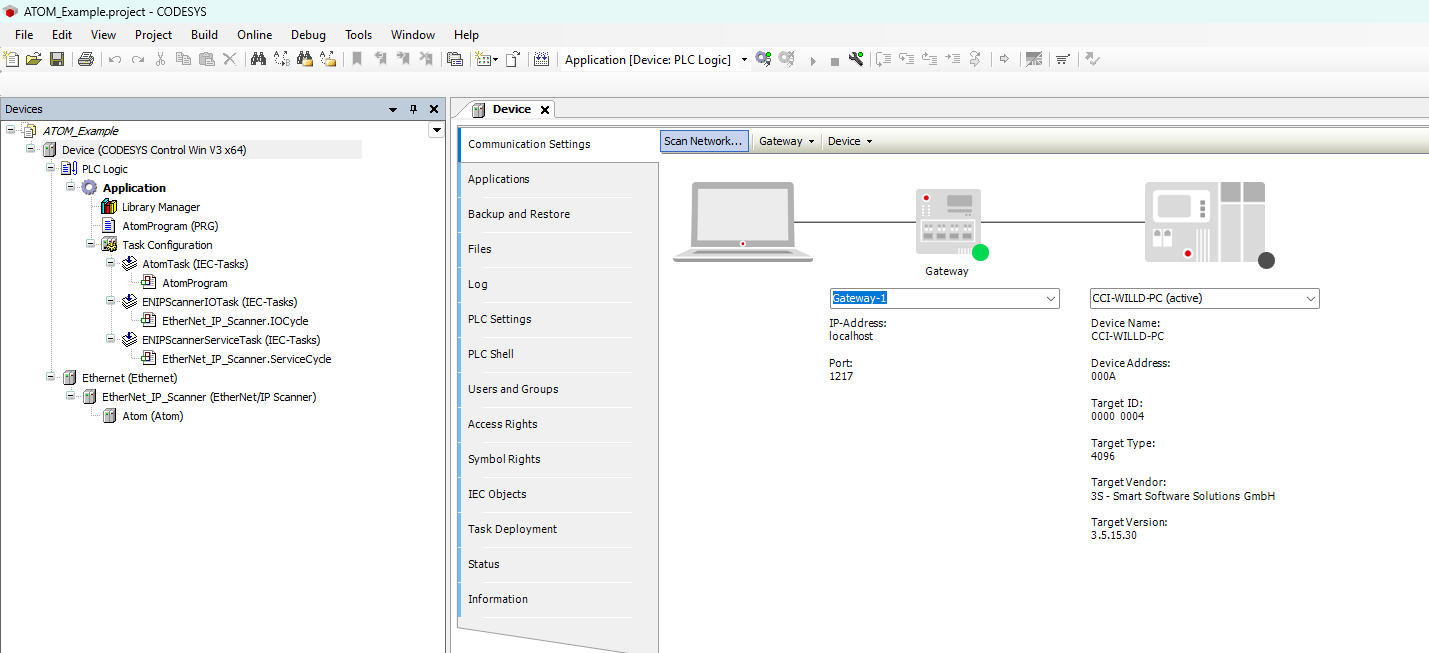
Next, in Codesys double click Application to open its configuration window. Here you can select Scan Network to discover your SoftPLC:
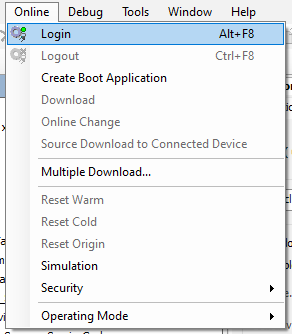
Finally, Login to your SoftPLC:
Then you can start debugging the program:

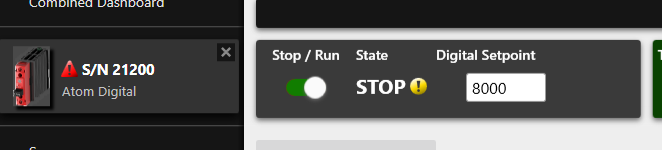
If you use Control Panel to monitor ATOM, you should see the Stop / Run state and the Digital Setpoint values change to reflect the PLC program's instructions. If you followed the structured text example, the values will change once and remain fixed. If you followed the ladder logic example, a visualization control panel will appear. Flipping the dip switch or adjusting the slider will immediately update ATOM and the changes should reflect in real-time: